Discover the benefits of using Dashboads as a business management tool

Blue Marble
Mar 14, 2023
Having information quickly and reliably should be something common for organizations these days, but we still see a great effort by professionals to gather and analyze data.
In this scenario, being able to rely on a dashboard as a management tool is an excellent alternative to make the data analysis and decision-making process much more agile and assertive in the corporate environment.
Think of the countless activities that are directly linked to running a business.
And now imagine how the task of managing these activities can be confusing, exhausting and, many times, even unproductive.
In this article, we'll talk about what dashboards are and how to apply them in a business context to facilitate the management of these tasks and the monitoring of different business processes.
In short, data driven culture – or, in translation, data-driven culture – is a concept The dashboard (or panel) is a tool for displaying and monitoring relevant indicators and metrics, with the main objective of enabling integration and visualization information from different sources, organizing data in a centralized, visual and dynamic way, to facilitate decision-making and process management.
Because it is a management tool that is characterized by the wide possibility of customization, there are several models of dashboards that can be created, varying according to the need and objective of the business.
But, above all, a dashboard should always help in the interpretation of the collected data in a simple and objective way.
Here is a caveat. Just as there are different formats and models of dashboards, there are also different sources from which it is possible to extract and collect data, in addition, of course, to different technologies and software in which it is possible to produce them.
Every company, whether large or small, generates a massive volume of data on a daily basis.
However, without the correct organization and modeling for a more efficient analysis, this data becomes a mere record, becoming little or not at all productive for a manager who is seeking to act in a more agile and assertive way.
In practice, this means that companies that do not have organized processes for data analysis may be making wrong, late decisions, spending more or even missing opportunities.
By placing the data in a real context and/or perspective, it is transformed into insights and valuable information about the business.
And it is from the analysis of this information that it will be possible to perceive trends, identify patterns and draw projections to obtain more satisfactory results in several areas of the company.
In other words, the sustainability and competitiveness of business depends on the quality of the decisions taken.
And that's where the power and versatility of a dashboard as a management tool come into play, as they make it possible to view data, understand information and measure results visually, promoting smarter management.
In the scope of business management, it is interesting to highlight that the definition of success indicators, as well as the collection, organization and analysis of data, among other processes, are a set of activities that characterize a strategy of business intelligence.
As we have seen, we can define a dashboard as a management tool that helps to follow, in a concrete and very visual way, metrics and data that indicate the performance of the processes of a business or of a specific area within the company.
Thanks to its wide possibility of customization, it is possible to find several models of dashboards, after all, we can create them according to different business objectives and monitoring needs of the end user.
It is worth mentioning that, within an organization, teams and professionals with different work functions will not use the same dashboard models, since the data analysis profile varies according to the demand of those who will use it.
In summary, considering the visualization model of the data that needs to be tracked, we can divide most dashboards into two main categories – operational and analytical.
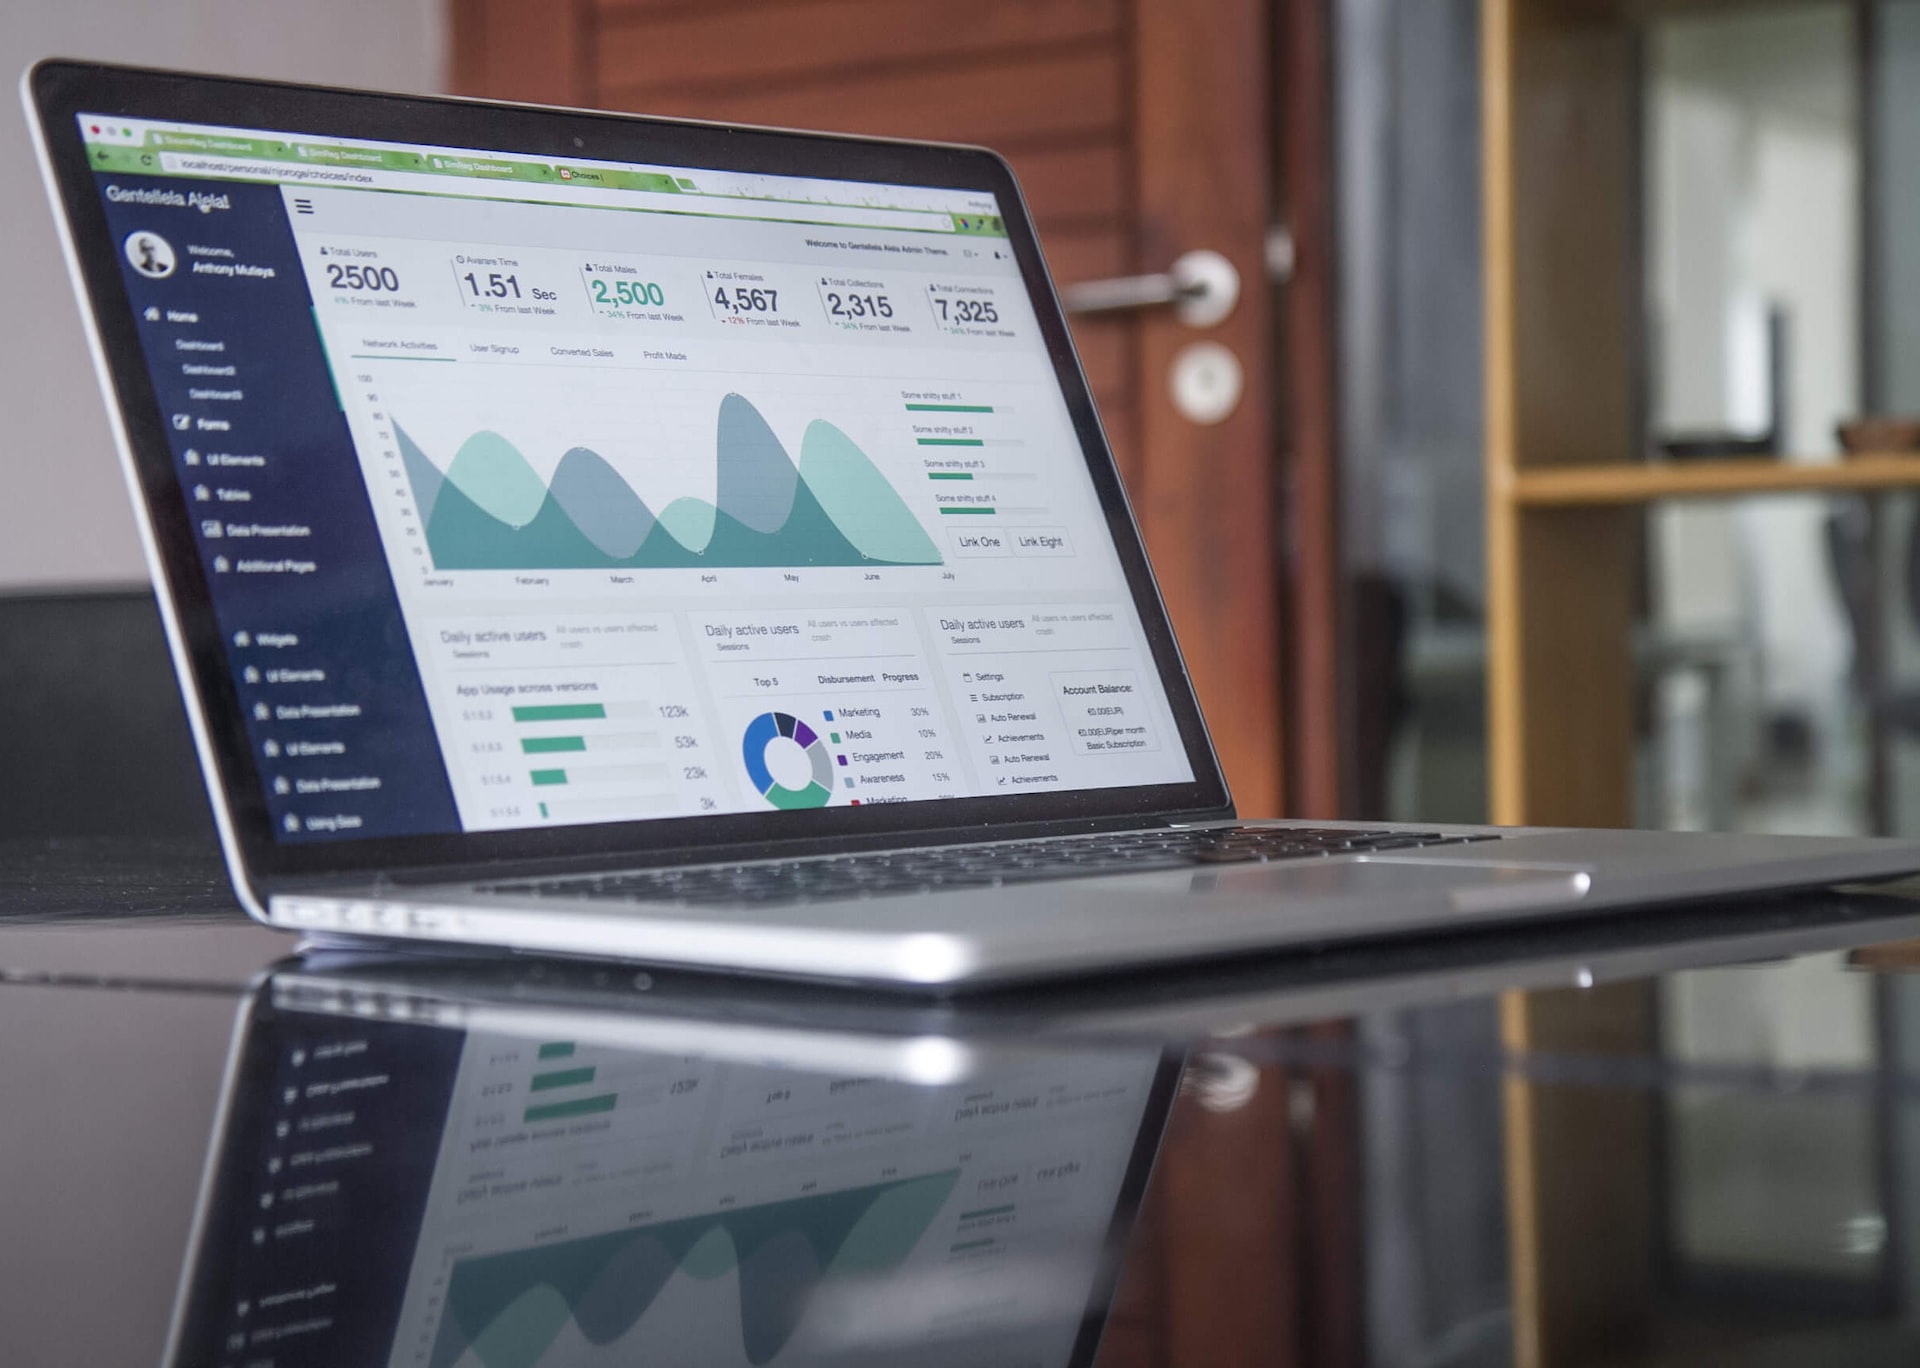
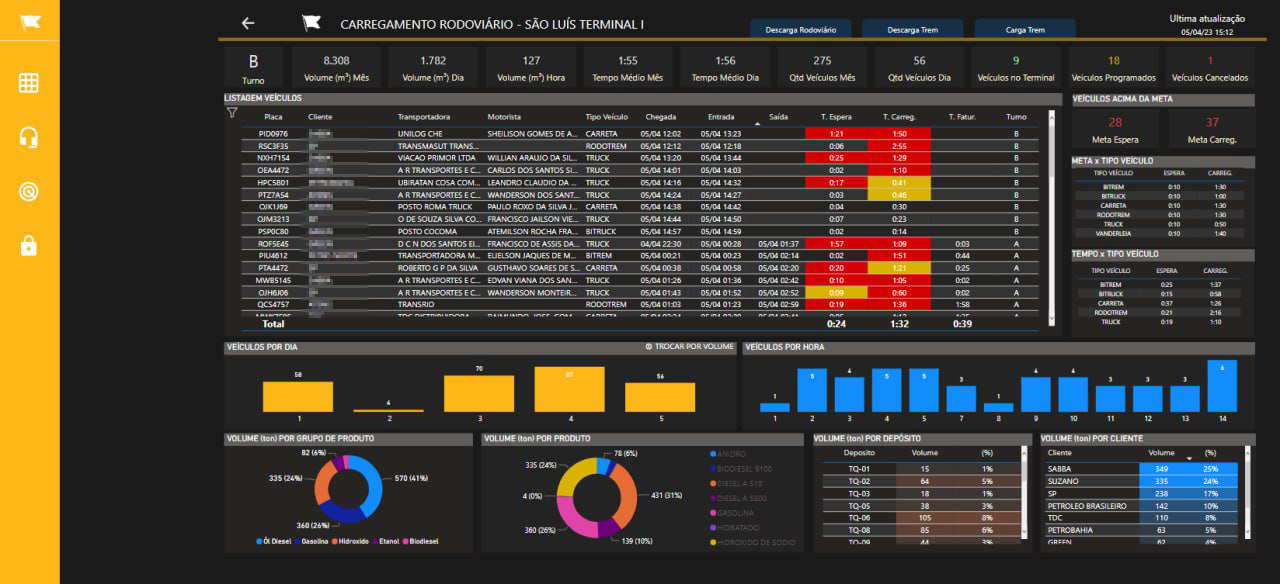
An operational dashboard is intended to show, in a clear, dynamic and quick way, the main indicators and a picture of the events that are taking place in a system, process or project.
Since its main objective is to keep track of goals, the operational dashboard tends to present the greatest amount of information relevant to the day-to-day of the system under study, arranging the data in a way that facilitates decision-making.
Dashboards of this type are commonly displayed on large screens or monitors so that they have broad visibility, and so that the chances of detecting problems and failures are greater, thus accelerating a possible action by the professionals involved to reverse this unfavorable scenario for the health of the business.
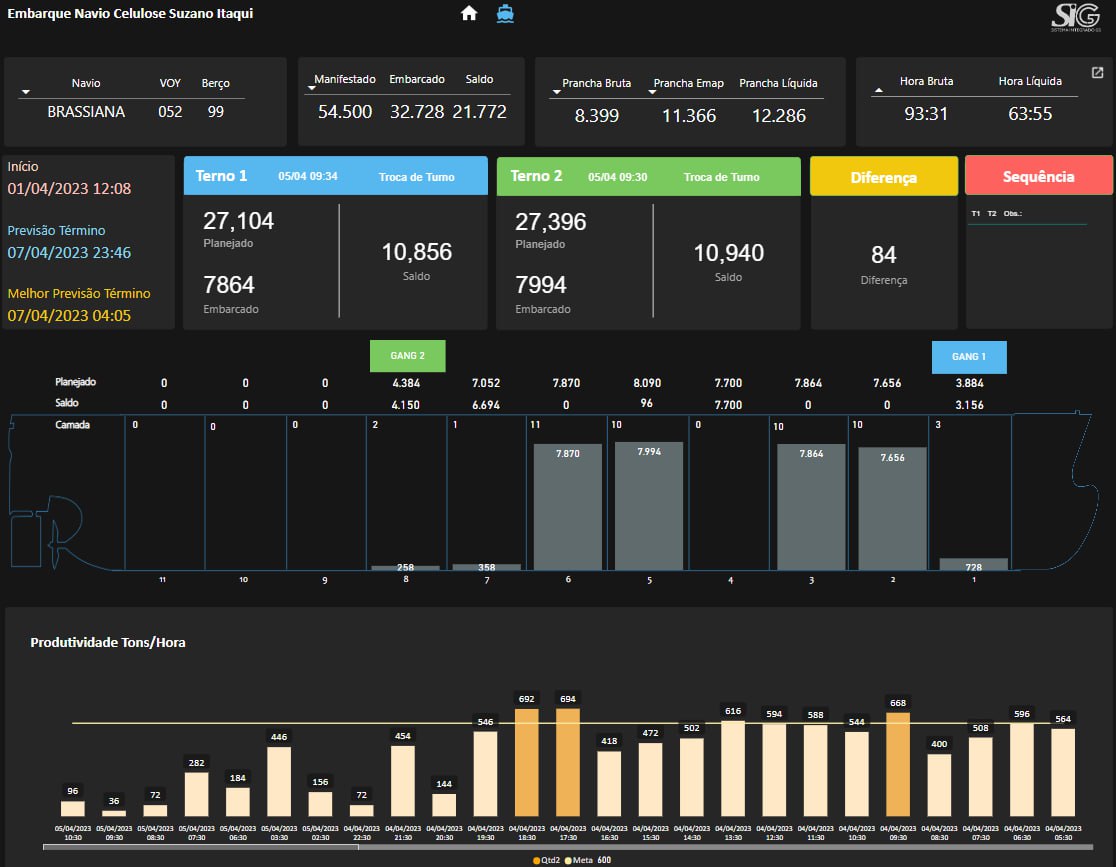
A scenario that well exemplifies the use of an operational dashboard is the almost real-time monitoring (NRT) of simple indicators and values captured by sensors on the factory floor, such as a beer production line, for example.
This dashboard would have line graphs and cards showing information such as temperature values for each machine, volumetric fill level, water and beer pH, etc. In this type of visualization, it is usually expected that it will be possible to detect equipment failures.
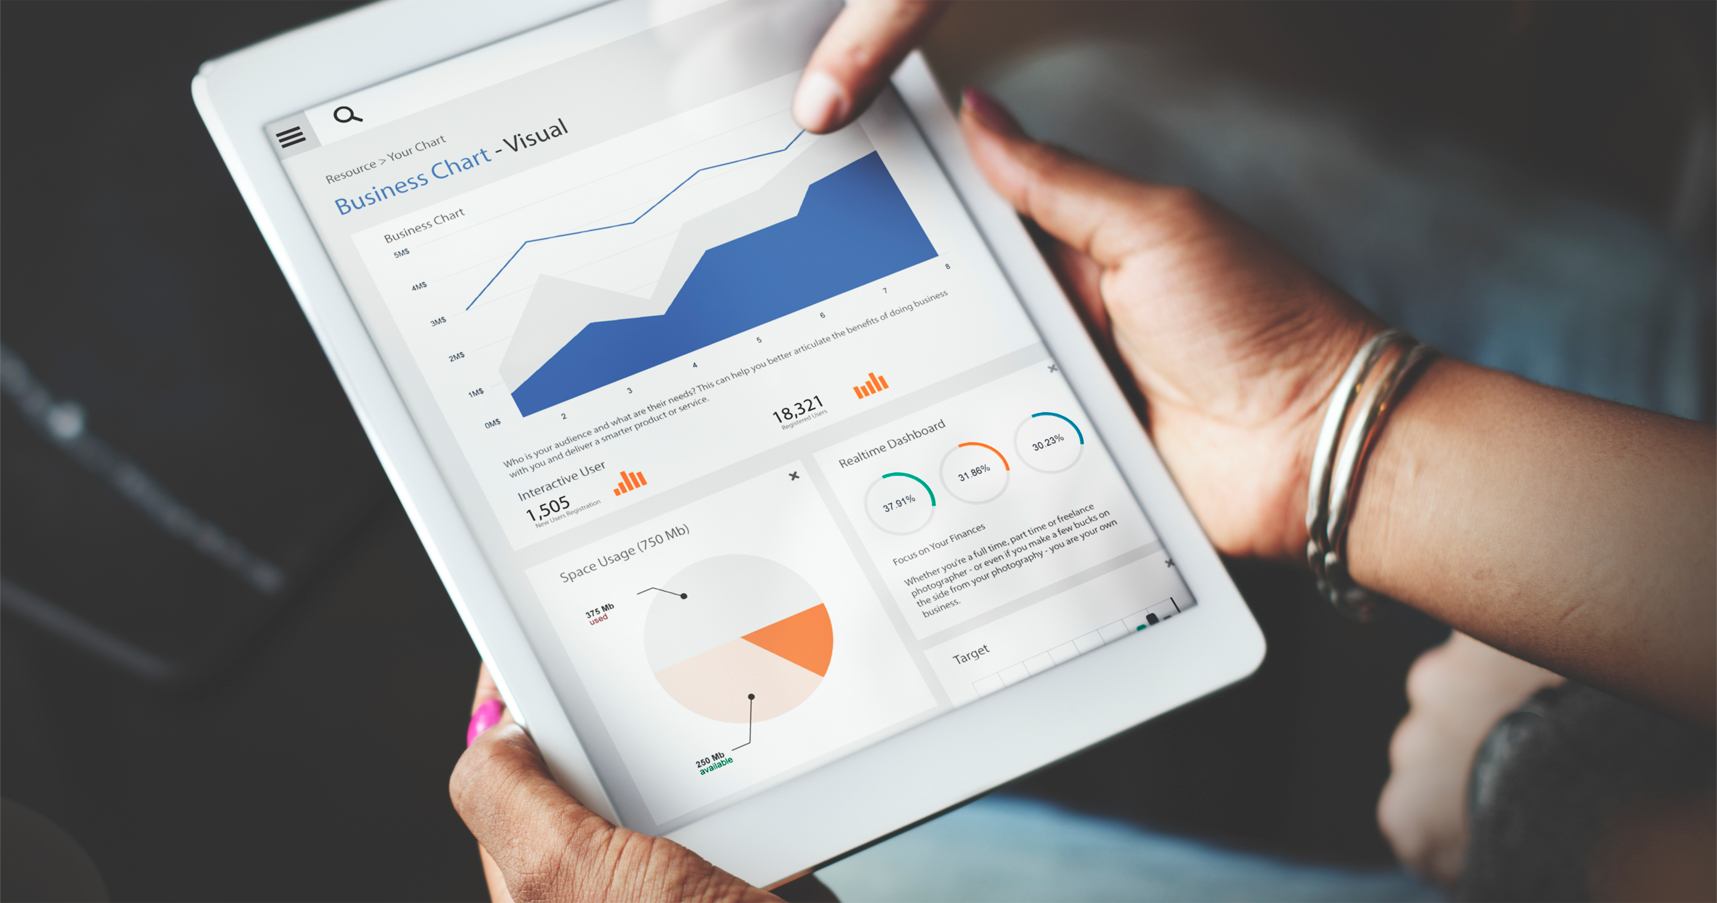
An analytical dashboard, as its name suggests, is developed with the aim of promoting a series of analyzes, made possible by the data presentation format, which makes it easier for the user to recognize patterns and trace trends.
The objective here is to ensure that employees from different areas are able to identify the opportunities and risks of a process more clearly and promptly, as well as having insights to leverage better results when carrying out their activities.
A very common modeling in this type of dashboard is the grouping of data so that the end user is able to analyze a historical series. That is, data collected from a certain period of time.
However, an analytical dashboard is not just for evaluating the past.
This model is also used for predictive analysis, that is, to try to anticipate what might happen in the future. This is possible thanks to the application of data science concepts and techniques.
As you can see, building analytical dashboards often involves more advanced Business Intelligence features.
This happens because, in most cases, the indicators presented there are related to more strategic objectives, allowing the stakeholders involved in the process to identify points of action to improve results.
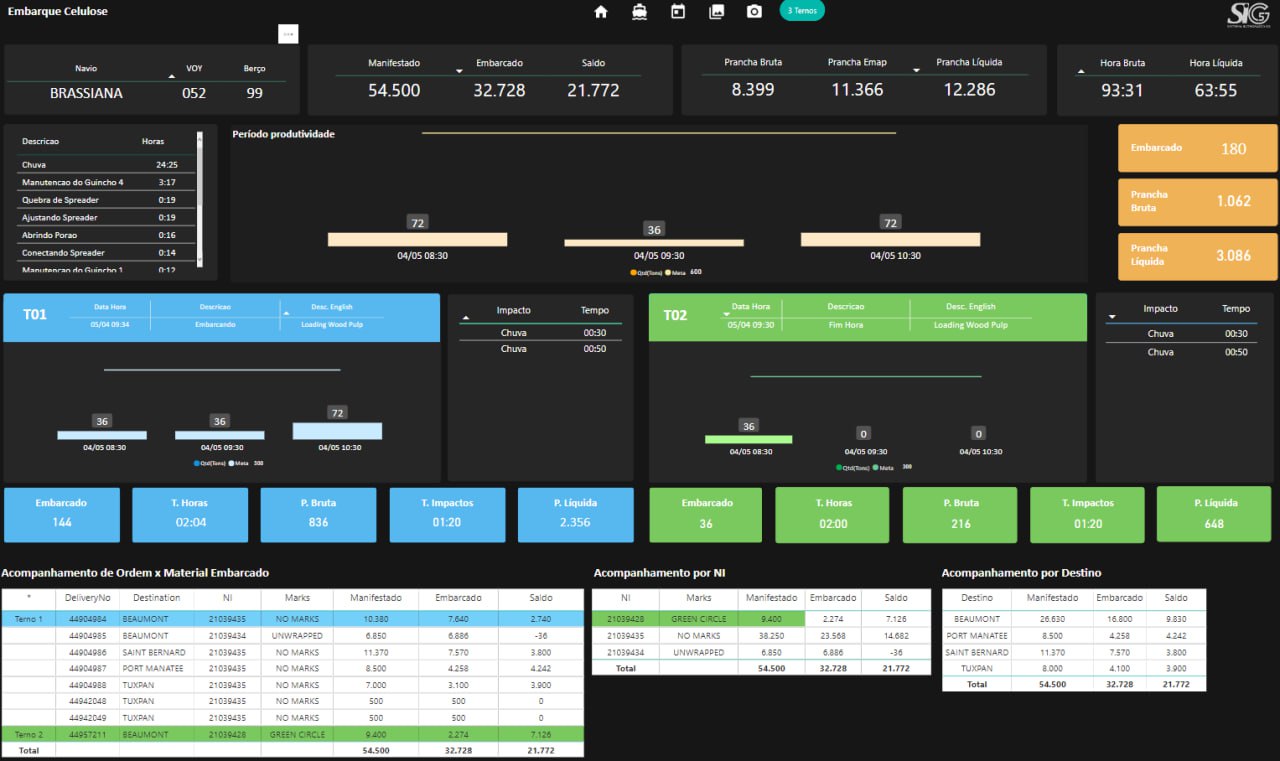
In practice, a good example of this more strategic use would be, say, for a lending company, which could use an analytical dashboard to visualize the default pattern of its creditors.
Through it, it could be possible to visualize that only 70% of loan installments are paid on time, while the other 30% are in arrears. Crossing this with the other available data, the aim will be to identify common factors to understand the causes of late payments.
Maybe you haven't realized it yet, but we've just gone through the first steps of the journey towards data-based management, that is, the beginning of the long road that a company needs to go through to become, in fact, data driven.
Remember we talked about Business Intelligence before?
Well, it is often thanks to the implementation of a dashboard as a management tool and business intelligence software that business managers begin to act in a data-oriented way.
In this context, tools such as dashboards and reports developed with the help of business software – such as Power BI da Microsoft – are responsible for enabling an organization to manage its data more intelligently.
In short, this is the objective behind Business Intelligence strategies.
But keep in mind that whatever software you choose, always prioritize the one that has the capacity to meet your business needs.
This fact becomes even more relevant when we talk about the possibilities of integrating different data sources to use a dashboard as a management tool.
In the case of Power BI, it is possible to collect data from spreadsheets, cloud applications, databases, social networks, among others.
In addition to numerous other advantages, Power BI also offers the possibility of creating dynamic dashboards and reports quickly and visually, enabling analysts and managers to interpret business and market information more quickly and assertively.
Power BI can be used by virtually any area and hierarchical level of a company, from production, human resources, sales, marketing and finance.
In addition, the dashboards created in Power BI allow the monitoring of activities and business performance indicators in order to leverage the results of all processes in an organization.
And for more effective business management, it is important to maintain information transparency, ensuring more assertive decision-making, based on data and not guesswork.
Therefore, having a dashboard as a management tool makes it easier for leaders and their teams to have access to indicators and results of processes and projects
As we saw throughout this article, Business Intelligence tools are essential for companies that seek a more strategic management, based on data culture.
To make this concept a reality within organizations, it is essential to have a dashboard as a management tool to meet business needs.
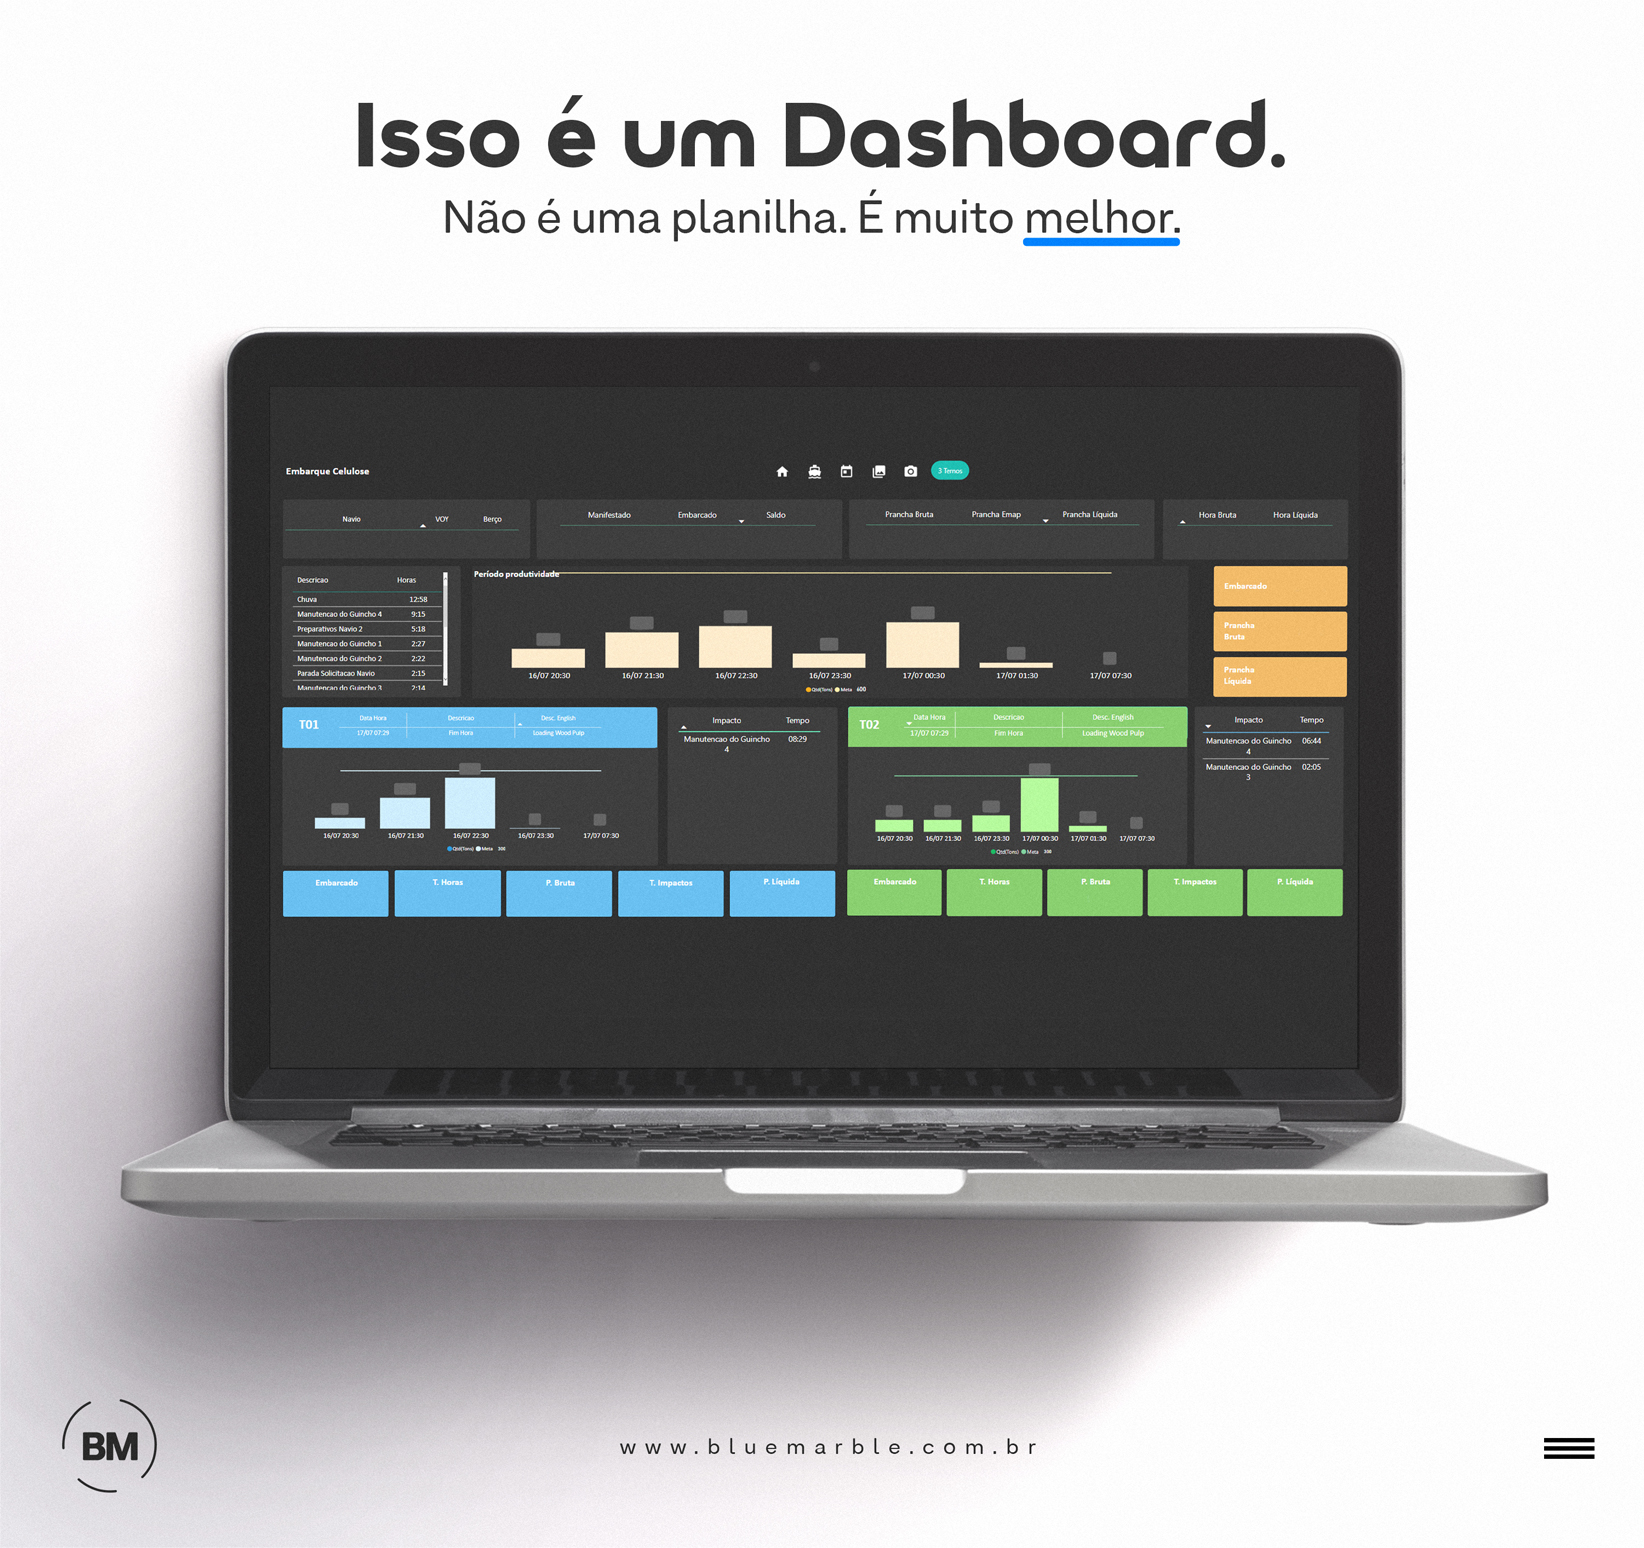
If you're starting from scratch, moving away from spreadsheets and looking to implement software effectively, you need a partner to help you build a data analytics strategy.